
Read : Hydrograph
Also known as -
English : hydrograph
A hydrograph is a graph showing changes in the amount of water flowing into a dam or river and the water level over time. The graph will show time on the horizontal axis and flow rate and water level on the vertical axis.
By creating this graph, it is possible to see numerical values of the flow of water over time during flooding and changes in the water level of water storage for water diversion.
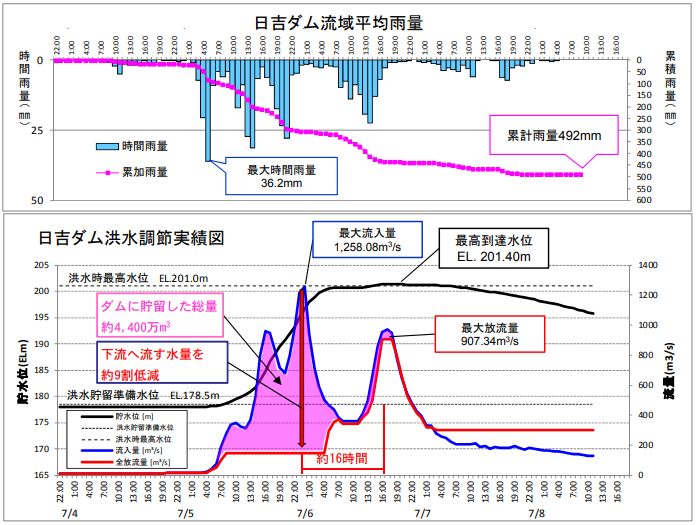
The above graph shows the flood control at Hiyoshi Dam during the heavy rainfall in July, 2008. Note that the "Hiyoshi Dam Basin Average Rainfall" graph above is based on the "hyetographand the "Hiyoshi Dam Flood Control Results Chart" below is the "hydrograph".
From this hydrograph of Hiyoshi Dam, it can be read that flood control is conducted as follows. Note that the graph above is preliminary and may contain errors.
- Until midnight on 7/5, the amount of water flowing into the dam lake (inflow, blue line) and the amount of water released from the dam (total discharge, red line) will be the same to maintain the water level and free up storage for the anticipated flood.
- While releasing water early in the morning of 7/5, the water flowing into the dam lake is stored (of course, the water level rises rapidly in the meantime).
- Maximum inflow was recorded on 7/6 around midnight. In the meantime, the discharge was maintained and further storage continued (without the dam, 1,258.08 m3/s of water would have rushed downstream as it was).
- Water level of the dam lake reached the highest flood level from early morning of 7/6 to early morning.
- 7/6 at approximately 3:10Extreme Flood Disaster Prevention Operation(proviso operation), but did not actually start immediately (it can be read that they were trying to buy time to evacuate, even if it was at their own will).
- Conducted an abnormal flood disaster prevention operation on 7/6 at around 4:05
- The maximum discharge is reached around 16:00 on 7/6. Allow approximately 16 hours for evacuation during this time.
- Discharged before dawn on 7/7 at a constant volume (late discharge)
Thus, the hydrograph provides a readout of the dam's fight against flooding.

Comment