
Reading: Hietograph
Also known as -
English : hyetograph
A hyetograph is a graph that shows how the raindescendingThe amount of time to beprogressThe graph is shown together with thehorizontal axisTime tovertical axisindicates such things as location of person or thing, location of short-term action, etc.amount of rainfallThe graph will show the
from thisby the hourThe intensity of rainfall per appearance.graspThe company can do the following.
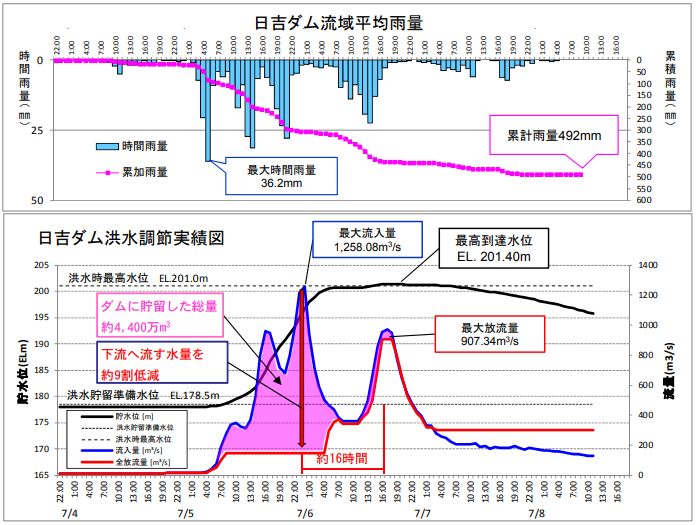
July, 2008torrential raininlucky dayDam.Flood Control Effects(in Japanese history)Citation.Hiyoshi Damadministration office)
The above graph shows the flood control at Hiyoshi Dam during the heavy rainfall in July, 2008. Note that the "Hiyoshi Dam" aboveBasin Average RainfallThe graph of "Hietograph" is called "Hietograph" and the graph of "Hiyoshi Dam" belowFlood control performance chartIf the "hydrographThe "will be".
Comment