
読み方 : ハイエトグラフ
別名 : ―
英語 : hyetograph
ハイエトグラフとは、雨が降る量を時間の経過とともに表したグラフを示す。横軸に時間、縦軸に降雨量を示すグラフとなる。
これにより時間単位あたりの降雨の強さを見た目で把握することができる。
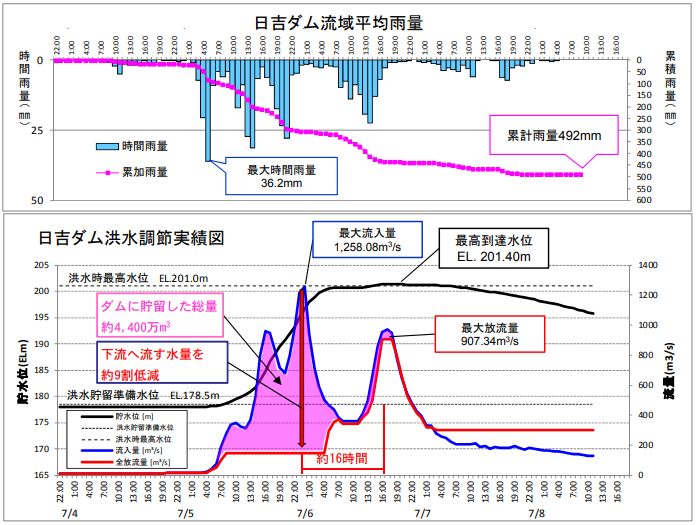
平成30年7月豪雨における日吉ダムの洪水調節効果(引用元:日吉ダム管理所)
上図は平成30年7月の豪雨時に行われた日吉ダムの洪水調節を表したグラフである。なお、上の「日吉ダム流域平均雨量」のグラフを「ハイエトグラフ」と言い、下の「日吉ダム洪水調節実績図」が「ハイドログラフ」となる。
コメント